
Evaluation of consumption and economics of operation
Measuring various quantities is an integral part of smart home services and management. Sometimes the name "smart metering" is used, which is not entirely apt, because "smartness" does not lie in the measurement itself, but in the evaluation of the measured data in the control system. It is especially important to measure energy in their various forms (consumed or produced electricity, consumed gas and water). Measurement and long-term evaluation of temperatures and their time course - in individual rooms, outdoor temperatures, domestic water temperatures are also important.
The measured data can provide the user with information on energy management and the operating costs of the building. These can be long-term data on aggregate consumption for a certain period (eg in individual days, months, from the beginning of the heating season, for the end of the heating season, for the billing period of energy suppliers) and on the corresponding costs. Users may also be interested in data on current consumption and the corresponding "cash flow". These are perceived as informative - it is probably not usual for the user to directly influence the current consumption of the house, eg turn off the heating, close the window, stop the shower, turn off, turn off the TV, etc. Measured data can help correct long-term activities and behavior household members. According to them, it is possible, for example, to adjust time programs of temperatures in individual rooms, to draw attention to long-term opening of windows, etc. Summary data usually serve to evaluate the long-term condition and as a basis for "strategic" decisions, such as possible window replacement, facade insulation, change or innovation of the technical equipment of the building, the effectiveness of the boiler replacement, the installation of a solar system, a heat pump or a hot water storage tank, or just a change of energy supplier.
More sensors know more. Relationships with diagnostics and security
By cleverly evaluating data on consumption and the condition of the house, it is possible to obtain ("extract") important information about the condition of the house and the activities of its inhabitants, as well as information for securing the building - warnings of risks, potential threats or directly alarms. By remotely monitoring the current consumption values, it is possible to indirectly infer the occupancy of the house or its individual rooms. For example, a non-standard energy consumption in a house that should be empty can signal the unexpected return of a resident, as well as a burglary or technical fault. Extremely high values of energy consumption can signal a danger to an object or an accident, such as a burst pipe, a gas or water leak, a short circuit or a fault in an appliance. Alerts can also be triggered by unusual consumption values during the monitoring period (eg at night or when the family is on holiday). Excessive temperature or its unreasonably rising trend may also warn of the risk of fire. Increased concentration of carbon dioxide (CO2) can only be
call for ventilation. Its current value and the trend of its growth is at the same time a reliable indicator of room occupancy, or the number of people and their activities. More information and their greater credibility is provided by the evaluation of a larger number of data obtained by measuring various quantities that are related to each other, or trends of their changes. For example, the suspicion of a gas leak caused by excessive gas consumption can be supported by comparing it with increasing values from air quality sensors. Similarly, the relationship between the disproportionately high temperature and its increasing trend can be evaluated in combination with data from smoke and CO sensors. An infrared sensor (PIR) is traditionally used to control lighting. However, it can reveal the presence of people in individual rooms and their movement within the building. Along with sensor data CO2 the information
can be supplemented by an estimate of the presence of people, their number and activity - even if the PIR sensor does not detect movement. In combination with camcorder images, people can also be identified.
The presence of people in the house can also be inferred from electricity consumption. The total consumption data provides only very rough information about the condition of the house, but it can also be deduced from many - in any case, the activity data of powerful appliances can be used as a warning before leaving the house (eg oven or electric heater not turned off, gas burner off water). From the time course of consumption over a longer period, it is possible to infer the development of the condition of the house and the activities of its inhabitants - especially with knowledge of the power input of individual appliances (Fig. 1a ÷ 1d). More detailed information can be obtained at measurements at several locations (eg at different sections of electrical distribution, or water or gas pipelines). They can be used to calculate costs between tenants and users of the house, or to quantify operating costs for different parts of the building (eg for individual floors, separate parts of the building, etc.).
Measurement and Tecomat Foxtrot
If the house or other object is controlled by the Tecomat Foxtrot system produced by Teco as, it can be advantageously used for measurement, comprehensive evaluation of measured data and visual display of results - not only in the form of text messages (eg alarms) and numerical data, but especially in graphical form , eg in the visualization scheme of the house and its rooms, or in the form of time courses. To do this, the Foxtrot system primarily uses the resources of the web server, which is part of each central unit. For more demanding cases, it is also possible to use means for visualization and long-term archiving of Reliance SCADA system data. The communication capabilities of Tecomat Foxtrot systems enable remote access to data (eg via a mobile phone, tablet or computer), as well as sending data to the cloud and making it available to other computer systems. Sensors connected to the inputs of the Foxtrot central unit and their expansion modules can be used for the measurement itself, as well as data from other modules (produced by Teco or other manufacturers), which can be connected to one of the standard buses. It is advantageous to use modules communicating with the central Foxtrot module via the CIB (CFox system) or wirelessly by radio communication (RFox system). Detailed descriptions of the CFox system modules, together with the recommended connection and communication with the central module and its program, are given in the manual: Peripheral modules on the CIB bus - TXV 004 13.01, which is freely available at www.tecomat.com. Other useful publications can be obtained at the same address: CFox, RFox and Foxtrot Design Guide - TXV 004 16 rev.3d. It is a very comprehensive publication that deals with the description of modules and methods of measurement in various fields that can be found in building technology, especially: heating, cooling and ventilation, photovoltaic power plants, water heating, lighting and socket circuits, blinds, shading, windows and doors, burglar alarm, EPS, access control, user communication and multimedia. Of particular importance is the description of the measurement of temperature, energy and non-electrical quantities, and the monitoring of other quantities.
Electricity meter module C-EM-0401M Various modules and procedures described in these manuals can be used to measure electricity. The CFox bus series includes the C-EM-0401M electricity meter and quality meter module (Fig. 1). It is designed for remote monitoring of electricity consumption and mains voltage quality. It is equipped with four inputs for voltage measurement, four current inputs and one relay output (protection relay). Current inputs are intended for connection of external current measuring transformers - bushing or split. The mechanical design corresponds to the "switchboard" 6M design for mounting on a DIN rail. The basic parameters of the module are given in Table 1, a detailed description of all parameters is given in the manual. Basic documentation of the C-EM-0401M (TXV 133 22), available at www.tecomat.com. Table 2 provides an overview of the data transmitted from the meter to the central module via the CIB bus. Initially, the C-EM-0401M meter is designed for fast and accurate measurement of a three-phase network (generally four single-phase measurements) - frequency, phase voltages, currents, active and reactive powers, power factor, THD voltages and currents in low voltage (LV) networks . It measures in the range of 15 to 150 A, optionally 5 to 600 A. It is equipped with voltage and frequency protection for controlling photovoltaic power plants (PV, HFVE) and cogeneration units. The electricity meter evaluates 128 samples per period, sampling is controlled by the frequency of the first phase. The measurement is continuous, without interruption. The basic evaluation interval is 200 ms. In the same interval, the instantaneous values of active power for production and consumption (in source or appliance mode) can be read via the bus. Other values can be read with query commands as needed. In addition to voltages, currents and active powers for each phase, the meter also provides values of reactive, apparent, deformation, fundamental active and reactive power, power factor, harmonic and THD voltages and currents, harmonic voltages and currents up to the 63rd harmonic.
Several ideas for the use of the C-EM 0401M electricity meter in the energy of a family house and a large building.
One meter module can typically measure a three-phase home network. The fourth input can be used for independent additional measurement on another single-phase branch. However, it can be measured on four independent single-phase branches. If it is necessary to measure more single-phase leads, it is possible to connect more meters to one Foxtrot central module via the CIB bus.
The C-EM-0401M electricity meter does not serve as a certified meter for billing measurement. However, it can be used to allocate electricity consumption among several tenants of a building or to quantify the consumption of parts of a more complicated building.
The measuring speed predetermines the C-EM-0401M electricity meter to block the overflow into the network. If the owner of the building is able to generate electricity (usually photovoltaic panels) and does not hold a license for supplies to the electricity grid, he must not allow short-term overflows into the grid. The beginning of the overflow is indicated by the electricity meter by a change in the sign of the measured power. The simplest (but least suitable) measure is immediate disconnection from the source (photovoltaic inverter). If we assume a thoughtfully designed Foxtrot system program, which "has the control of the house in its hands", then it can use the produced energy efficiently, eg use it in another appliance (eg boiler, heat or cold storage) or "store" energy in a battery storage.
In buildings where price tariffs depend on compliance with a quarter-hour maximum (usually industrial buildings), the electricity meter can be C-EM-0401M use to regulate the quarter-hour maximum (eg by disconnecting suitable appliances or using own resources, eg from batteries).
Similarly, it is possible to solve the limitation of power input to buildings (and to family houses) so that the current value of the main circuit breaker is not exceeded. It is usually sufficient to decide whether to allow or reject the requirement to start key appliances, exceptionally by disconnecting some appliances or using own resources.
With the knowledge of instantaneous power input, the price of electricity can be optimized. At a time when energy from the network is cheap, it is possible to activate appliances of an accumulative nature (storage heaters, electric boilers, boilers, heat or cold storage tanks, swimming pools, washing machines) or to store energy directly in accumulators. On the contrary, at a time when energy is expensive, it is expedient to limit consumption as much as possible or, conversely, to supply energy from one's own sources to the grid.
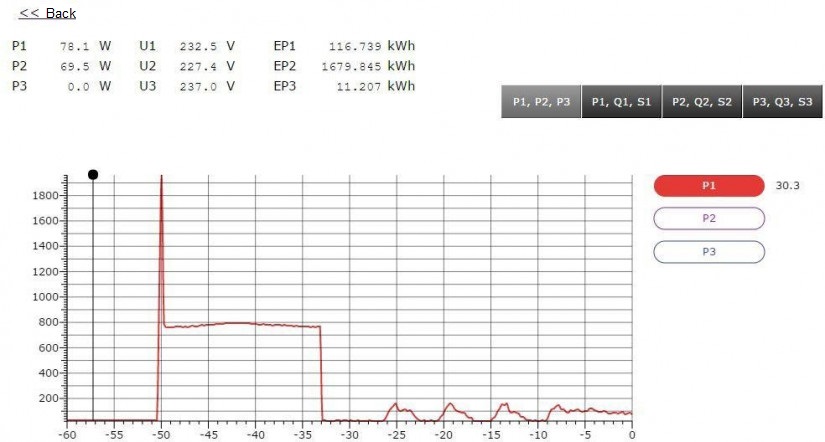
Fig1c. Waterworks and then the washing machine: on phase 1 you can see the start (peak) and then the steady running of the waterworks, small ripples after a time of -24 s correspond to the active washing machine
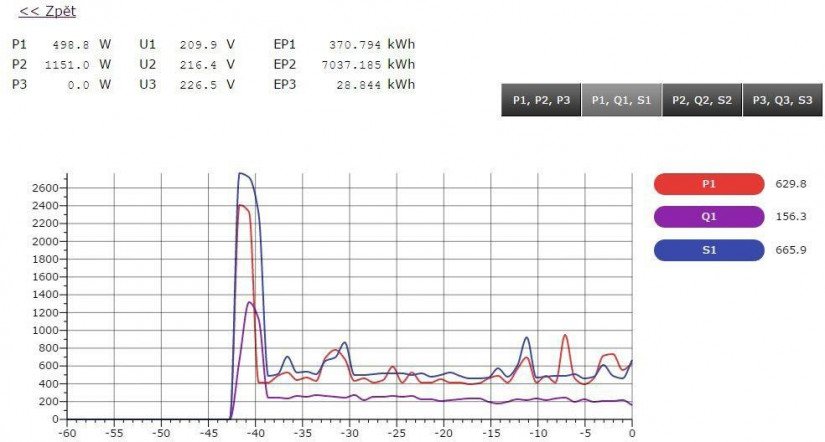
Fig.1d Large mower: start and then mowing, active (P1, orange), reactive (Q1, purple) and apparent (S1, blue) power of the electric mower - start (tip) and then steady mowing
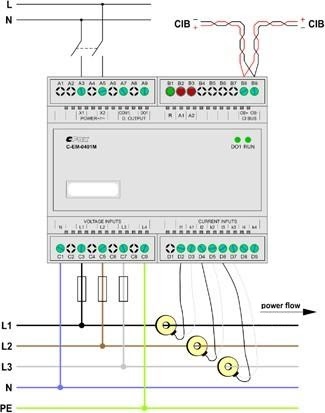
Fig. 2. Typical connection of the C-EM-0401M electricity meter module for measuring a three-phase circuit
Table 1. Basic parameters of the electricity meter module C-EM-0401M
| Voltage inputs | |
| Number | 4 |
| Measuring range (ULN) | 6 ÷ 300 V AC |
| Measurement accuracy | ±0,05 % of value, or
±0,02 % of range |
| Current inputs | |
| Number | 4 |
|
Nominal current INOM |
5 ÷ 250 A AC |
| Measuring range | 0,0025 ÷ 1,
2× INOM |
| Measurement accuracy | ±0,05 % of value, or
±0,02 % of range |
| Power supply from CIB | |
| Power supply
and communication |
24 V (27 V)
from the CIB bus |
| Maximum consumption | 15 mA |
| Auxiliary supply voltage | |
| Range | by type, 10÷275V AC/DC |
| Power consumption | 3 VA/3 W |
Table 2. Data transmitted from the C-EM-0401M electricity meter to the Foxtrot central unit via the CIB bus
| variable name | format and range | meaning |
| Frequency | 32bit/real | frequency |
| ULN1 | 32bit/real | voltage 1 |
| ULN2 | 32bit/real | voltage 2 |
| ULN3 | 32bit/real | voltage 3 |
| UN | 32bit/real | voltage 4 |
| I1 | 32bit/real | current 1 |
| I2 | 32bit/real | current 2 |
| I3 | 32bit/real | current 3 |
| IN | 32bit/real | current 4 |
| cos(⎞)1 | 32bit/real | phase power factor 1 |
| cos(⎞)2 | 32bit/real | phase power factor 2 |
| cos(⎞)3 | 32bit/real | phase power factor 3 |
| cos(⎞)N | 32bit/real | phase power factor 4 |
| P1 | 32bit/real | active power 1 |
| P2 | 32bit/real | active power 2 |
| P3 | 32bit/real | active power 3 |
| PN | 32bit/real | active power 4 |
| Q1 | 32bit/real | reactive power 1 |
| Q2 | 32bit/real | reactive power 2 |
| Q3 | 32bit/real | reactive power 3 |
| QN | 32bit/real | reactive power 4 |
| S1 | 32bit/real | apparent power 1 |
| S2 | 32bit/real | apparent power 2 |
| S3 | 32bit/real | apparent power 3 |
| SN | 32bit/real | apparent power 4 |