
1 Basic information
The PV Forecast service provides an exposure forecast for the next 24 to 48 hours for any point in the Czech Republic with an hourly or daily step. Data are provided as the average exposure W / m2 at a given hour or as the total daily amount in Wh / m2. Exposure values are related to the horizontal plane. An interface accessible via the http protocol (web) is used to transmit information to registered users.
2 Principle of data acquisition
To obtain the data, it is necessary to compile a query with the client key and the location that was entered during registration. It is also possible to select the required data format and length in the query. The predicted exposure is updated twice a day before 12 and 24 o'clock. It should be taken into account that with each subsequent calculation, the forecast is refined. Despite the fact that data for the same period are provided after 12 o'clock and after 24 o'clock, the forecast is more accurate after 24 o'clock. For this reason, it is a good idea to interview twice a day.
Temperature and precipitation total forecast are provided as additional information. The temperature is provided in ° C with an hourly step or as a daily minimum and maximum. The total precipitation is given in millimeters per hour or in millimeters for the whole day.
An interface accessible via the http protocol is used to transmit information to registered users.
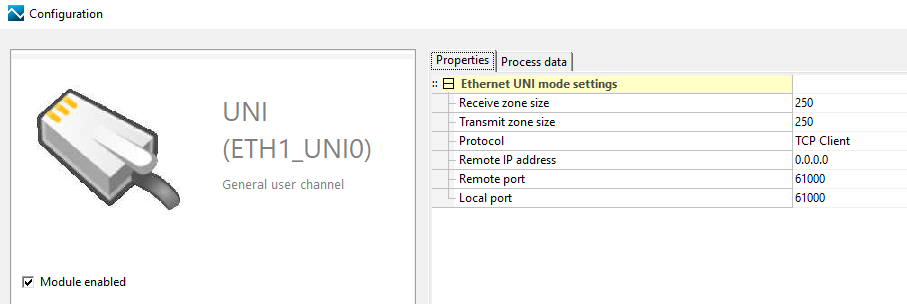
3 Communication channel settings
The Ethernet interface in the PLC is used for communication. The size of the receive and transmit zones is 512 bytes, the protocol is set to TCP Client and the remote port is 80.
4 PVF_Forecast Function block
The function block is used to obtain a forecast of solar exposure on a horizontal surface, temperature and precipitation total for 48 hours in an hourly interval. The forecast is updated before 12 noon and noon, and from noon onwards the forecast for the next day is available, which is further specified by the forecast issued before midnight.
4.1 VAR_INPUT
|
Variable |
Type |
Description |
|
enable |
BOOL |
Activation of data download |
|
chanCode |
UINT |
Communication channel code (eg constant ETH1_uni0) |
|
key |
STRING[20] |
Key received during registration |
|
lat |
REAL |
Latitude |
|
lon |
REAL |
Longitude |
4.2 VAR_IN_OUT
|
Variable |
Type |
Description |
|
data |
T_PVF_Prediction |
A structure containing a 48-hour forecast |
4.3 VAR_OUTPUT
|
Variable |
Type |
Description |
|
done |
BOOL |
Indication that the forecast download is complete |
|
busy |
BOOL |
Indication that the forecast is being downloaded |
|
error |
USINT |
Error code |
|
errorMsg |
STRING[255] |
Description of the error |
5 PVF_GetPower function block
The function block converts the value of solar exposure on the horizontal plane to the energy generated by photovoltaic panels, which have a defined inclination, azimuth, peak kilowatt-peak power and efficiency.
5.1 VAR_INPUT
|
Variable |
Type |
Description |
Minimum | Maximum |
|
enable |
BOOL |
By activating the variable, the conversion is performed |
||
|
lat |
REAL |
Latitude |
48,5 | 51 |
|
lon |
REAL |
Longitude |
12 | 19 |
|
inclination |
REAL |
Tilt, ° |
0 | 90 |
|
azimuth |
REAL |
Azimuth, ° |
-90 | 90 |
|
kiloWattPeak |
REAL |
kWp of photovoltaic power plants |
0,01 | 100 |
|
efficiency |
REAL |
Efficiency |
10 | 100 |
5.2 VAR_IN_OUT
|
Variable |
Type |
Description |
|
data |
T_PVF_Prediction |
A structure containing a 48-hour forecast |
5.3 VAR_OUTPUT
|
Variable |
Type |
Description |
|
done |
BOOL |
Indication that the forecast download is complete |
|
busy |
BOOL |
Indication that the forecast is being downloaded |
|
error |
USINT |
Error code |
|
errorMsg |
STRING[255] |
Error description |
6 Example of use
6.1 Program
The example uses function blocks to download the PVF_Forecast forecast and convert it to the PVF_GetPower energy produced. The example also uses a function block to plot three time courses in a single graph. It is not part of the library, but in the project it is possible to modify the source code of this function block.
VAR_GLOBAL RETAIN
    key         : string[20];
    irrad       : real;
    lat         : real;
    lon         : real;
    inclination : real;
    azimuth     : real;
    kWp         : real;
    efficiency  : real;
END_VAR

VAR_GLOBAL
  graph_data : ARRAY [0..2, 0..PVF_PRED_MAX_SIZE] OF REAL;
END_VAR

PROGRAM prgMain
  VAR_INPUT
  END_VAR
  VAR_OUTPUT
  END_VAR
  VAR
      busy : BOOL;
      downloadEnable : BOOL;

      Forecast : PVF_Forecast;
      PowerFromIrradiation : PVF_GetPower;
      forecast_data : T_PVF_Prediction;

      errorForecast : string[255];
      errorPower : string[255];

// Graphs
      Graph : fbGraph3;
      Graph_Names : T3xSTRING8 := ['irr.','power','temp.'];
      Graph_Enabled : T8BitArray := [true, true, true];
      Graph_CanvasData : TCanvasData2048;
  END_VAR
  VAR_TEMP
      i    : UINT;
  END_VAR

    forecast(
        enable := downloadEnable AND NOT busy,
        chanCode := ETH1_uni0,
        key := key,
        lat := lat,
        lon := lon,
        data := forecast_data,
        errorMsg => errorForecast);


    PowerFromIrradiation(
        enable := forecast.done,
        lat := lat,
        lon := lon,
        inclination := inclination,
        azimuth := azimuth,
        kiloWattPeak := kWp,
        efficiency := efficiency,
        data := forecast_data,
        errorMsg => errorPower);

    IF PowerFromIrradiation.done THEN
        FOR i := 0 TO (PVF_PRED_MAX_SIZE - 1) DO
            graph_data[0,i] := forecast_data.irradiance[i].value;
            graph_data[1,i] := forecast_data.power[i].value;
            graph_data[2,i] := forecast_data.temperature[i].value;
        END_FOR;
    END_IF;

    busy := forecast.busy or PowerFromIrradiation.busy;

    IF not busy THEN
        downloadEnable := false;
    END_IF;

    Graph(
        autoSize := 1,
        ratio := 1.8,
        minX := 0,
        maxX := 47,
        numPoints := UINT_TO_UDINT(PVF_PRED_MAX_SIZE),
        valid := UINT_TO_UDINT(PVF_PRED_MAX_SIZE),
        data := graph_data[0,0],
        enabled := Graph_Enabled,
        c := void(Graph_CanvasData),
        names := Graph_Names);
END_PROGRAM
6.2 Graphs
The graphs show three different waveforms, where it is possible to switch between them or display them all at once, but one Y-axis is used, which causes the temperature and generated energy waveforms in the graph to be almost visually lost. When you click on a place in the graph, the values of the waveforms at a specific point are displayed.
Associated documents
- PVForecast - Software project with a demonstration of use
- PV Forecast Library